Achetez un moniteur et partagez vos données sur la qualité de l'air dans votre ville.

(Heure locale)
CLASSEMENT MONDIAL DE l’IQACONTRIBUTEURS DE DONNÉES SUR LA QUALITÉ DE L'AIR
210 Contributeurs


Voir tout
| # | city | IQA US |
|---|---|---|
| 1 | Adélaïde, Australie-Méridionale | 2 |
| 2 | Geelong, Victoria | 3 |
| 3 | Brisbane, Queensland | 4 |
| 4 | Broken Hill, Nouvelle-Galles du Sud | 4 |
| 5 | Gladstone, Queensland | 4 |
| 6 | Melbourne, Victoria | 6 |
| 7 | Gold Coast, Queensland | 10 |
| 8 | Swan Hill, Victoria | 10 |
| 9 | Wagga Wagga, Nouvelle-Galles du Sud | 13 |
| 10 | Millthorpe, Nouvelle-Galles du Sud | 15 |
(Heure locale)
CLASSEMENT MONDIAL DE l’IQA
Appli n°1 pour la qualité de l'air
App gratuite pour la qualité de l’air sur iOS et Android


2023 Moyenne de la qualité de l’air

Bon
2023 Moyenne de l’US AQI
19
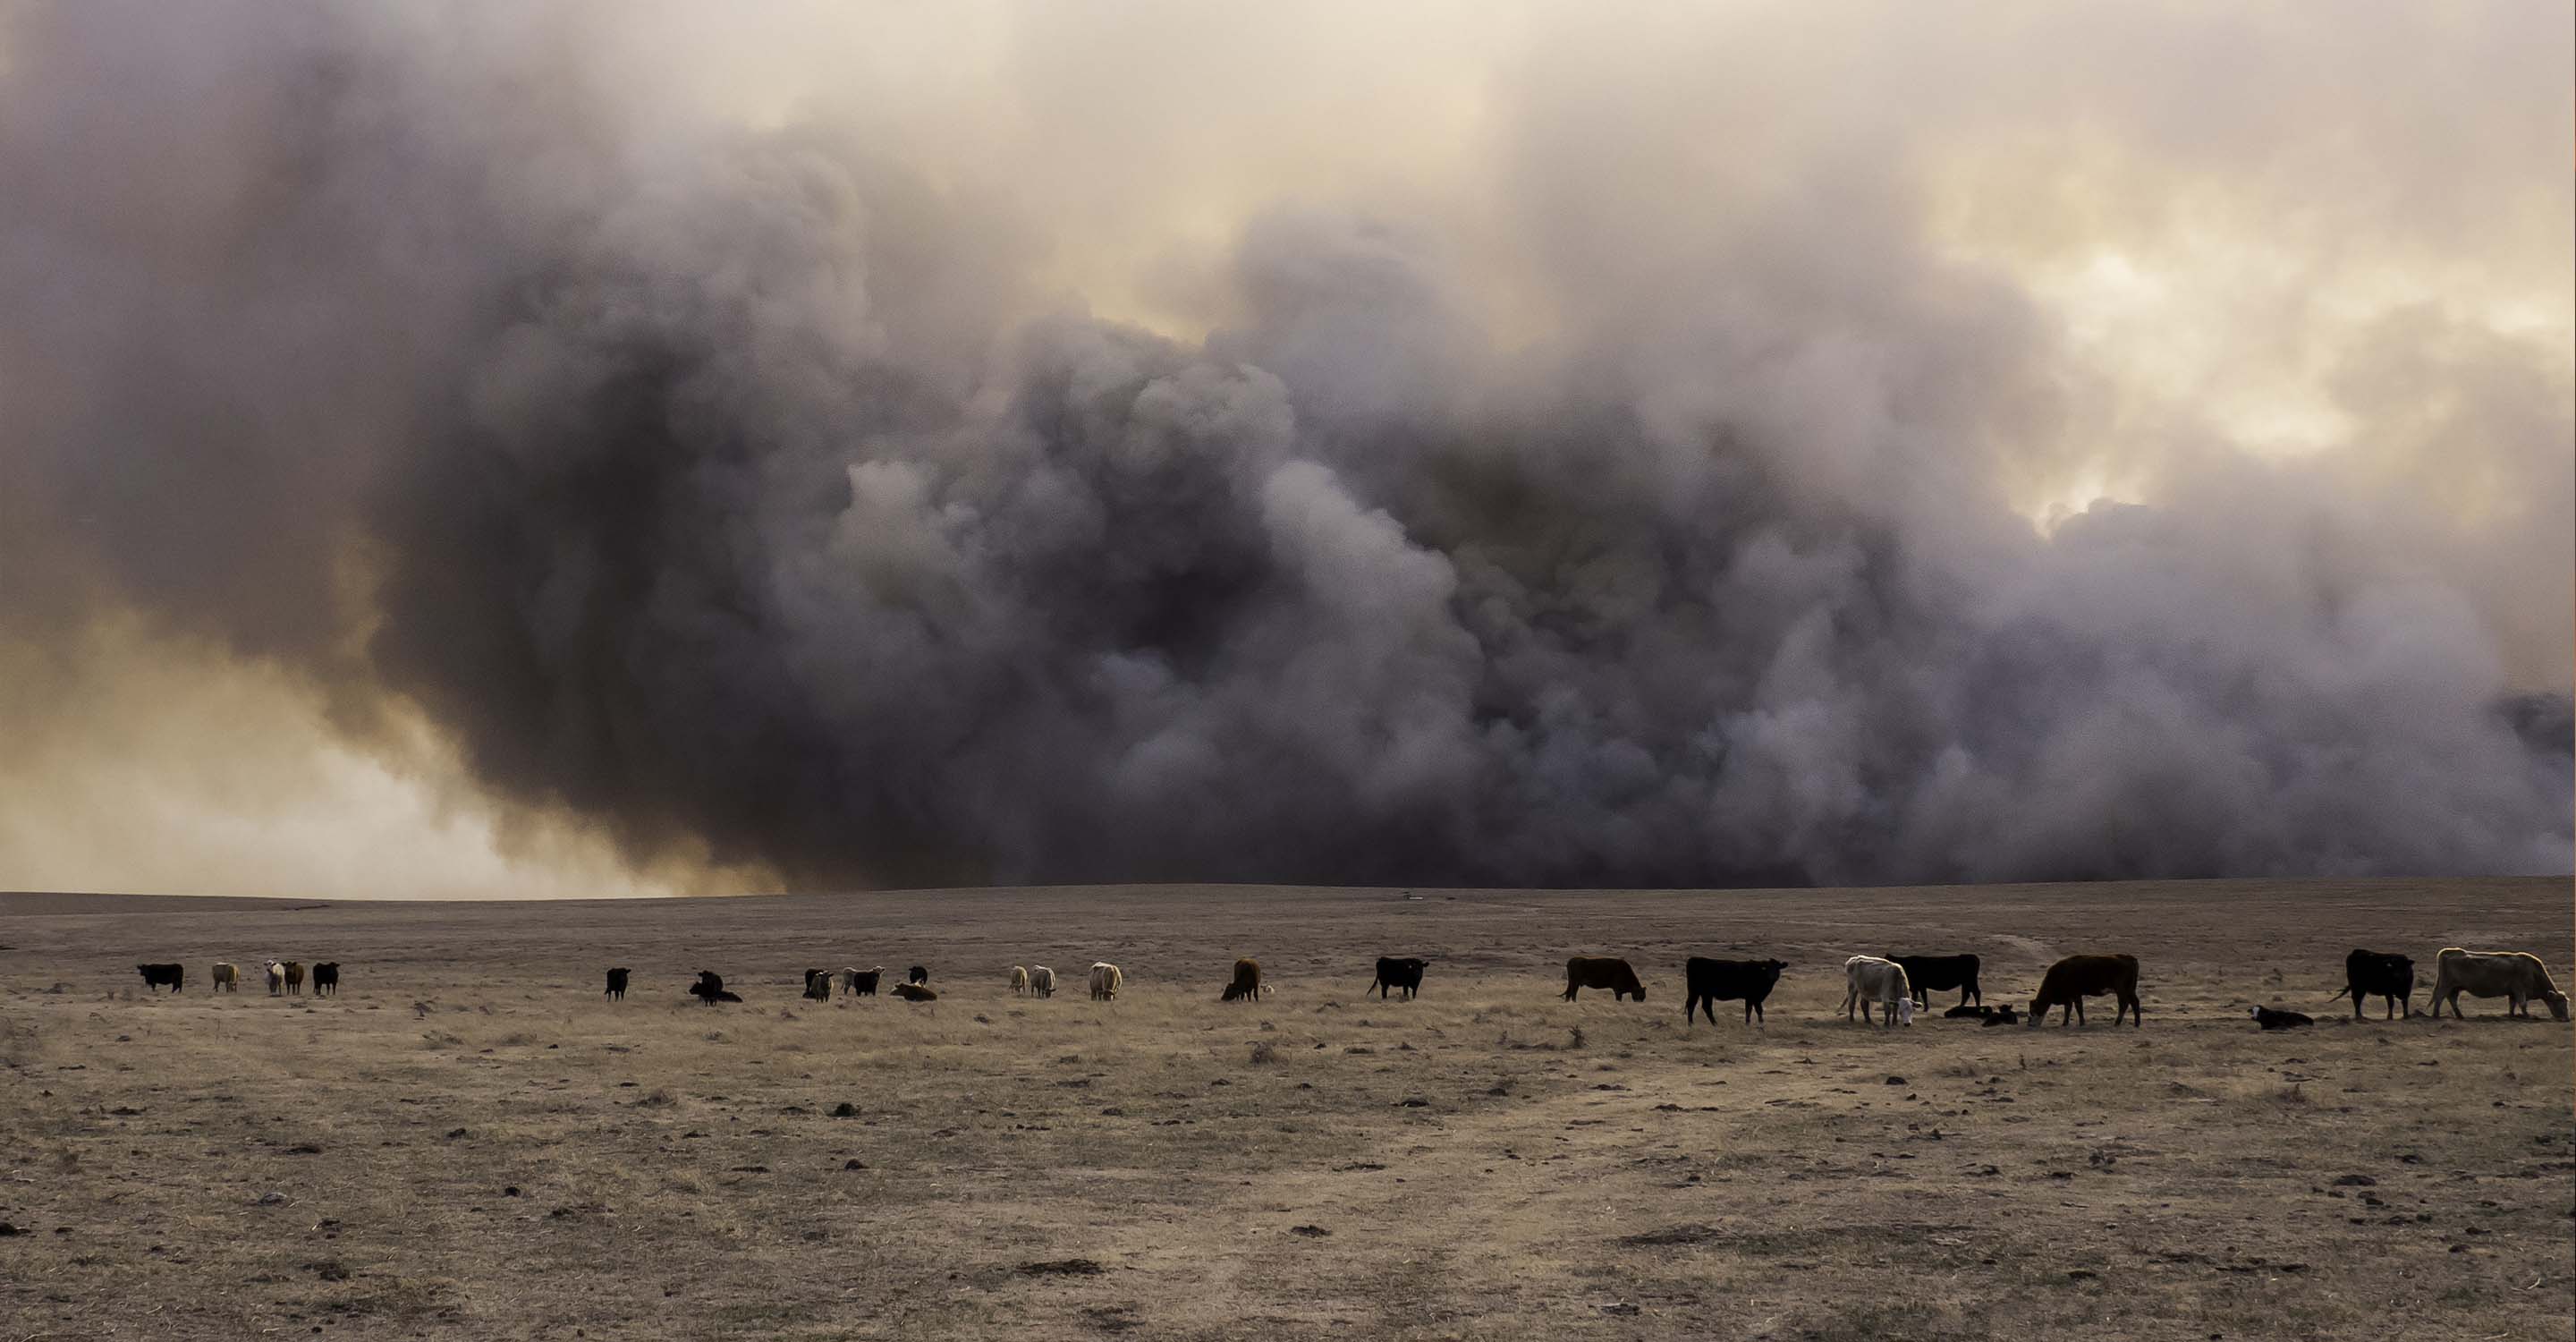
La concentration en particules PM2.5 en/au/à Australie respectent les lignes directrices de l'OMS
| 2023 Ville la plus propre en Australie | Underwood , Tasmania 7 |
| 2023 Ville la plus polluée en Australie | Rocklea , Queensland 43 |
Actualités
Dernières actualités et ressources sur la qualité de l'air.
| # | PAYS | Population | Moyenne de l’US |
|---|---|---|---|
| 1 |  Bangladesh Bangladesh | 169,356,251 | 164 |
| 2 |  Pakistan Pakistan | 231,402,117 | 160 |
| 3 |  India India | 1,407,563,842 | 147 |
| 4 |  Tajikistan Tajikistan | 9,750,064 | 134 |
| 5 |  Burkina Faso Burkina Faso | 22,100,683 | 128 |
| 6 |  Iraq Iraq | 43,533,592 | 121 |
| 7 |  United Arab Emirates United Arab Emirates | 9,365,145 | 119 |
| 8 |  Nepal Nepal | 30,034,989 | 118 |
| 9 |  Egypt Egypt | 109,262,178 | 118 |
| 10 |  Democratic Republic of the Congo Democratic Republic of the Congo | 95,894,118 | 114 |
| 128 | Australia | 25,688,079 | 19 |
210Contributeurs
Principaux contributeurs gouvernementaux
90 stations
34 stations
14 stations
5 stations
3 stations
1 station

1 station
Principaux contributeurs parmi les entreprises
1 station
Principaux contributeurs individuels
1 station
1 station
1 station
1 station

1 station
1 station
1 station
1 station
1 station
1 station
1 station
1 station
1 station

1 station
Anonymous Contributors

185 stations
Top 10 Data sources
DCCEEW New South Wales Western Australia Dept of Water and Env Reg Environment Protection Authority for Victoria State Environment Protection Authority